To create trending videos using Google Flow, you open Flow from Google Labs, start a new project, and paste a detailed shot prompt into the prompt box. If you want the same face in every scene, you save that person once under Characters and call them with @ inside every prompt. That is the whole thing. The tool is not the hard part — the prompt is.
This guide shows both workflows I actually use, with screenshots of every screen and two real prompts you can copy today: one for throwaway random characters, and one for consistent characters that stay the same across a full video.
What is Google Flow?
Google Flow is Google’s AI video creation studio, built on the Veo and Gemini generation models. You describe a shot in plain language and it returns a short cinematic clip with camera movement, lighting, dialogue and lip-sync. It lives inside Google Labs, not inside Gemini, which is why most people never find it.
Two things make Google Flow better than a normal text-to-video tool for short-form content:
Native dialogue and lip-sync — your character can actually speak your script, in your language, without a separate voice tool.
Saved characters — you build a person once and reuse them in every scene, so a 6-scene video looks like one film instead of six strangers.
Step 1: Open Google Flow
Search google flow on Google and open the first result — labs.google › tools › flow. That is the official one. Don’t click ads or lookalike sites.
Search “google flow” and open the first result from Google Labs.
Sign in with your Google account. Free accounts get a daily credit allowance; a Google AI Pro or Ultra plan gives you more generations and the newer models. Start free — you’ll know within ten clips whether it’s worth paying for.
Step 2: Create a new project
On the Flow dashboard, click + New project. One project = one video. Keep every scene of the same video inside the same project so your characters and clips stay together.
The Google Flow dashboard — click “+ New project” to start.
Inside the project you get a clean workspace. The prompt box sits at the bottom — “What do you want to create?” — and the left sidebar holds All Media, Characters, Scenes and Tools. Next to the send arrow you set the output: Video · 10s, aspect ratio, and how many variations to generate.
The project workspace. Prompt box at the bottom, Characters in the left sidebar.
Workflow 1: Trending videos with random characters (fast)
Use this when the video is one shot and nobody needs to reappear — comedy skits, product shots, city b-roll, meme videos. It takes about five minutes.
Get your prompt from ChatGPT or Claude first
Don’t type a one-line idea into Flow. Open ChatGPT or Claude, describe your idea in your own words, then ask:
Give me a prompt for Google Flow. Include camera movement, location, wardrobe, lighting, lens, dialogue with the exact lines, aspect ratio and duration. One continuous take.
You’ll get back a full shot description instead of a vague sentence. Paste that into the Google Flow prompt box and hit generate. That single habit is the difference between clips that look AI-made and clips that look shot.
Sample prompt — random characters
Here’s a real prompt from one of my own videos. Notice how specific it gets about costume, road, light and dialogue — nothing is left for the model to guess.
Cinematic tracking shot, camera on a vehicle moving parallel to a
motorcycle at matched speed, riders held frame right.
Two homemade costumed characters ride one motorcycle down a narrow
Kerala road — coconut palms and banana plants both sides, red
laterite shoulders, pastel houses, wet monsoon tarmac.
FRONT RIDER: lean young man in a tight hand-stitched emerald and
mustard cloth hood covering his whole head, crude black stitched
seams, two round dark goggle lenses sewn in. Torso in a matching
patched cloth top. Bare legs, loose orange boxer shorts, rubber
chappals.
REAR PASSENGER: bulkier man wearing chest and shoulder armor
obviously cut from painted aluminium cooking vessels, hammered
dents visible, held on with jute rope. A cheap plastic emergency
torch taped to his chest, glowing white. Repainted maroon motorbike
helmet. Bare legs, blue checked boxer shorts.
Handmade, low-budget, proudly ridiculous. No logos, no insignia.
The front rider turns to camera and speaks directly to lens,
animated, one hand off the bars gesturing.
Dialogue (Malayalam, casual energetic):
FRONT RIDER: "എടാ, ഇതുപോലത്തെ videos create ചെയ്യണോ? Comment ചെയ്യ് —
ഫ്രീയായി guide അയക്കാം. Page follow ചെയ്തോ!"
REAR PASSENGER (leaning forward): "വിട് speed ൽ വിട്!"
Golden hour side light, humid haze, shallow depth of field, palms
streaking with motion blur. Handheld micro-shake, 35mm lens, filmic
grain. 10 seconds, single continuous take.
Generate two or three variations, pick the best, and you have a post. Done.
Workflow 2: Character consistency in Google Flow (the good one)
This is the workflow that gets views. If you want a series — the same mother and daughter, the same host, the same mascot across 8 scenes — you need saved characters. Random prompts will give you a different face every single time, and that’s the number-one reason AI videos flop.
Step 1 — Write the character description with AI
Go to ChatGPT or Claude and describe the person you want: age, face shape, skin tone, hair, clothing, build, expression, the kind of light they’re lit in. Ask for a character description prompt for Google Flow. Keep it to appearance only — no story, no camera moves. A character is a person, not a scene.
Step 2 — Open Characters and create your character
In the left sidebar of your project, click Characters at the top, then create a new one. Flow gives you sample archetypes — The Eccentric, The Professional, The Familiar, The Wicked, The Fantastical, The Wildcard — or you can ignore them and paste your own description into “Describe your character…”. You can also Upload a real photo or pull an image in with Add from Project.
The New character screen — paste your description, upload a photo, or start from a sample archetype.
Give it a short, easy name — Mother, Daughter, nila — because you’ll be typing it constantly. Assign a voice too, so the same character always sounds the same. Then repeat for every person in your story.
Step 3 — Mention your character with @ in the prompt
Now type @ in the prompt box. Flow shows your saved characters, images, voices and uploads. Pick one and click Add to Prompt. The character is now locked into that shot — same face, same voice, every scene.
Type @ to mention a saved character. Notice the assigned voice attached to it.
Tell ChatGPT or Claude to write your scene prompts using the same @ names, and you can paste scene after scene straight into Flow without rewriting anything.
Sample prompt — consistent characters
@Mother and @Daughter are sitting on floor cushions beside a large
window in a peaceful family home at golden sunset. @Daughter looks
up at @Mother with genuine curiosity and says: "Mama, why do
Muslims pray five times every day?" @Mother listens with a soft,
loving smile. Natural realistic cinematic family drama, warm sunset
light, vertical 9:16, accurate lip-sync, no subtitles, no text,
no logo.
Short prompt, strong result — because the heavy work already lives inside the saved characters. Keep the same two @ names for scene 2, scene 3, scene 8, and the whole video holds together.
Prompt rules that make Google Flow videos look real
Name the camera. “Tracking shot”, “handheld micro-shake”, “35mm lens” — a shot without a camera looks like a screensaver.
Name the light. Golden hour, overcast, single window light, neon spill. Light is what sells realism.
Write the actual dialogue in quotes. Flow lip-syncs it. Vague “they talk about food” gives you mumbling.
One shot per prompt. Ask for three cuts in one prompt and you get mush. Generate separately, cut later.
Say what you don’t want. “No subtitles, no text, no logo” removes 90% of the junk overlays.
Set the ratio deliberately. 9:16 for Reels, Shorts and TikTok; 16:9 for YouTube long-form.
Mistakes to avoid
Typing one lazy line and blaming the tool for the result.
Skipping saved characters on a multi-scene video, then wondering why the face keeps changing.
Putting story and camera direction inside a character description — it belongs in the scene prompt.
Burning credits on 10 variations of a bad prompt instead of fixing the prompt.
Posting the raw clip. Trim the first and last half-second, add your hook text, then post.
FAQ
Is Google Flow free?
There’s a free tier with a daily credit allowance, which is enough to learn on. Heavier use and the newest video models need a Google AI Pro or Ultra subscription.
How do I keep the same character in every scene?
Save the person under Characters in your project, then mention them with @ in every prompt. Don’t re-describe them in text — that’s what breaks consistency.
Can Google Flow speak languages other than English?
Yes. Write the dialogue in the language you want, in its own script, and label the tone — as in the Malayalam example above. Lip-sync follows the written line.
How long can a Google Flow clip be?
Clips are short — around 8 to 10 seconds each. Longer videos are built by generating scene by scene with the same saved characters and stitching them in your editor.
Should I write prompts in ChatGPT or Claude?
Either works. Claude tends to hold long character and continuity details better across a series; ChatGPT is quicker for one-off shots. Use whichever you already have open.
The part nobody wants to hear
You’ll watch a video and think I can’t create that. You can. What you’re actually looking at is not a better tool — everyone has the same Google Flow, the same ChatGPT, the same credits. What you’re looking at is someone who thought harder about the idea before they typed.
Google Flow is a camera, not a director. It renders exactly the amount of thinking you hand it. If you give it “make a funny video”, you get slop — and there is already an ocean of that scrolling past people every day. If you give it a specific place, a specific person, a specific line someone would actually say, you get something people stop for.
So use AI as your writer, not your brain. Bring the idea, the joke, the emotion, the local detail only you know — then let ChatGPT or Claude shape it into a prompt and let Flow shoot it. Depend on AI for the idea and it will hand you average. Bring your own head to it and the same tool suddenly looks expensive.
Make one video today. It will be rough. Make the sixth one and you’ll stop asking whether you can.
Connect Indeed to Claude AI and it will read your CV, search live job listings, and hand you a scored, ranked shortlist with direct apply links. The setup takes about two minutes and you only do it once. Here is the full walkthrough, plus the exact prompt to paste.
Claude AI + the Indeed connector: your CV in, a ranked job shortlist out.
What you get at the end
A downloadable spreadsheet of 15–20 real, currently-open jobs. Every row is scored against your CV out of 100, sorted best-first, with a live Indeed link. You click the link, you land on the listing, you apply. No copying job titles into a search bar. No scrolling past roles you would never get.
How to connect Indeed to Claude
Step 1 — Open Claude
Go to claude.ai or open the desktop app and start a new chat. Connectors work on both web and desktop.
Step 2 — Click the + icon, then “New Connector”
The + sits at the left of the message box. Open it and choose New Connector — that is the menu where Claude links up to outside services.
Step 3 — Search “Indeed” and sign in
Pick Indeed from the list and log in with your Indeed account when the window opens. Approve access and you are done — Claude can now search live job listings on your behalf.
Give Claude your CV
Back in the chat, attach your CV or resume — PDF or Word, whatever you already have. Do not rewrite it first. Claude reads it as-is and pulls out your skills, job titles, years of experience, industry, achievements and certifications. Paste the prompt below in the same message.
The job search prompt to copy
Copy it exactly. The only thing worth editing is adding your city, or “remote only” if you have a strong preference.
I want you to act as my personal job search assistant. First, carefully analyze my uploaded CV/resume — extract my core skills, years of experience, past job titles, industry background, key achievements, and any certifications. Based on this, identify 3-4 job roles I'd be a strong fit for, along with my likely experience level (entry, mid, senior).
Next, use the Indeed connector to search for 15-20 current job openings that match these roles. Consider my location preference, and include both on-site and remote opportunities if available.
For every job you find, evaluate and score it out of 100 using this breakdown:
Skills match with my CV (40%)
Experience level alignment (20%)
Location/remote flexibility (20%)
Company reputation and salary range, if listed (20%)
Create a downloadable file (Excel or Word) with a table containing: Job Title, Company, Location, Match Score, one-line reason for the score, and the direct Indeed job listing link so I can click and apply. Sort from highest match score to lowest.
At the end of the table, highlight the top 5 jobs as 'Apply First' and give me a 2-line tip for each on how to tailor my application to stand out.
How the match score is calculated
Every job gets one number out of 100 so you can compare them at a glance. It is built from four parts:
What is measured
Weight
Skills matched against your CV
40
Experience level alignment
20
Location and remote flexibility
20
Company reputation and listed salary
20
Skills carry the most weight because that is what actually gets you past a first screen. A job in the 80s is worth a tailored application. A job in the 50s usually is not worth your evening.
Reading the file you get back
Sorted top to bottom. Start at row one. The list is already ranked for you.
Every row has a link. Click it and you land on the real Indeed listing, ready to apply.
One-line reason per score. If a good-looking job scored low, the reason column tells you why — usually experience level or location.
“Apply First” at the bottom. The top five, each with two lines on what to emphasise in that specific application.
Tips for better job matches
Name your city and whether you will relocate. Vague location means vague matches.
Upload the fullest version of your CV you have, not a trimmed one-pager. More detail in, more accurate scoring out.
If the roles Claude picks feel wrong, say so — “focus on operations roles, not analytics” — and ask it to run the search again.
Re-run it weekly. Listings turn over fast, and the search pulls live results each time.
One thing to check: Claude searches what Indeed has published, so if a listing is stale or already filled, that is the source, not the scoring. Skim the posting date on the listing before you spend time on a long application form.
Frequently asked questions
Is the Indeed connector free to use?
Connectors are part of Claude, and you sign in with your normal free Indeed account. You are not paying Indeed anything extra to be searched.
Does Claude apply to the jobs for me?
No. Claude finds, scores and links the jobs. You click through and submit the application yourself, which is what you want — a tailored application beats a bulk one every time.
What file format do I get?
Excel or Word, whichever Claude produces. Ask for one specifically if you have a preference — Excel is easier to sort and filter yourself later.
Can I use this with LinkedIn instead?
This guide covers the Indeed connector specifically. The same prompt structure works with any job-board connector Claude supports — swap the connector name in the prompt.
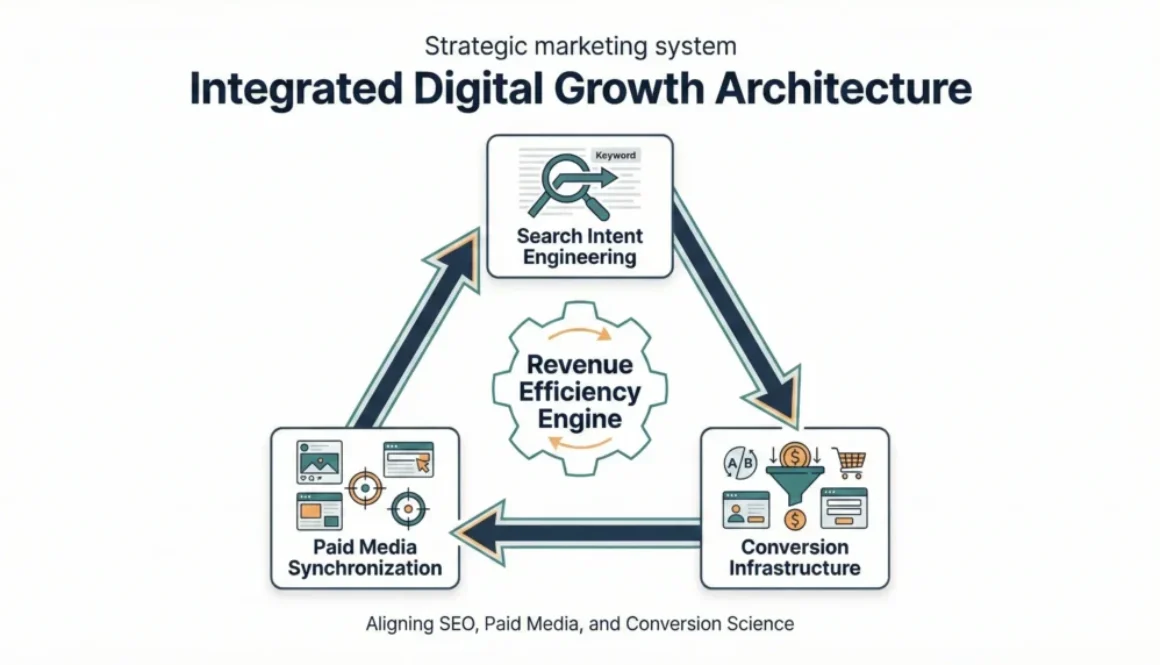
The Integrated Digital Growth Architecture: Aligning SEO, Paid Media, and Conversion Science for Sustainable Revenue
Most organisations that struggle with digital growth do not have a traffic problem. They have a systems problem. Channels operate in silos, teams optimise against isolated KPIs, and the cumulative result is a marketing organisation that generates activity without generating compounding value. Search teams chase rankings. Paid media teams chase ROAS targets. Conversion teams, where they exist at all, work downstream of both, reacting to traffic they had no hand in shaping.
The architecture problem is structural. When each function optimizes for its own metrics, the system cannot optimise for revenue. The relationship between acquisition cost, conversion probability, and customer value remains opaque, making it nearly impossible to deploy budget intelligently or forecast outcomes with any reliability.
his article is not about tactics in isolation. It is about the logic of integration: how search intent, channel synchronisation, and conversion infrastructure can be designed to function as a single revenue system rather than three separate cost centres reporting to the same CMO.
The Cost of Channel Fragmentation
Fragmented channel management has a measurable cost that most organisations either underestimate or misattribute entirely. When paid and organic search teams operate without shared intent data, the same keyword clusters are frequently addressed with different messaging, different landing pages, and different value propositions. The user experiences inconsistency. Conversion rates suffer. And because the fragmentation is structural, the failure never surfaces cleanly in any single channel’s reporting.
Blended customer acquisition cost, the true cost of acquiring a customer when spending across all channels is divided by total new customers, tends to rise over time in fragmented organisations. Gartner research on marketing effectiveness has consistently found that organizations with tightly integrated channel strategies achieve 20 to 30 cents greater marketing efficiency than those managing channels independently, largely because integrated teams eliminate redundant spend and align messaging with buyer stage more precisely.
The financial implication is not marginal. In competitive categories where customer lifetime value is three to five times acquisition cost, a 25 percent reduction in blended CAC meaningfully shifts the unit economics of growth. The organisations that achieve this are not necessarily spending more. They are spending differently, guided by a shared architecture rather than siloed optimisation loops.
Pillar One: Search Intent Engineering
Mapping Intent Layers to Revenue Potential
Search intent is not a binary distinction between informational and transactional queries. It exists on a spectrum, and where a query sits on that spectrum has a direct relationship to its conversion probability and downstream revenue value. Treating all search traffic as equivalent leads to misallocated content investment and distorted performance signals.
A more useful framework segments intent into four layers: investigative intent, which reflects early-stage research behavior; comparative intent, where buyers are evaluating alternatives; transactional intent, where the user is prepared to act; and retention intent, where existing customers search for support, upgrades, or adjacent solutions. Each layer has a different expected conversion rate, a different optimal content format, and a different relationship to paid media.
The critical insight is that most organizations over-invest in investigative intent content, which generates traffic and brand familiarity but rarely converts directly, and under-invest in comparative and transactional intent content, which drives revenue but requires deeper competitive understanding and more precise page architecture.
Revenue Density Modeling
Revenue density, the expected revenue generated per 1,000 organic impressions, provides a useful frame for prioritising SEO investment. It incorporates click-through rate by position, conversion rate by intent category, and average order or contract value. The calculation is straightforward in principle, but requires clean data to execute honestly.
Example calculation:
Consider a keyword cluster targeting comparative intent in a B2B software context:
Estimated monthly search volume: 4,200
Organic click-through rate at position 2: 14%
Monthly clicks: approximately 588
Conversion rate from page to qualified lead: 3.2%
Qualified leads per month: approximately 18.8
Lead-to-close rate: 22%
Closed deals per month: approximately 4.1
Average contract value: $8,400
Revenue density for this cluster: approximately $34,440 per month if ranking is achieved and maintained. Against a content production and link acquisition cost of $6,000 over six months, the ROI is substantial and scales without proportional cost increases as rankings stabilise.
This type of modelling reframes the SEO investment conversation from “how many keywords can we rank for?” to “which intent clusters deliver the highest revenue per dollar of organic visibility?”
The Paid and Organic Validation Loop
Paid search serves a purpose that goes beyond immediate revenue generation: it provides rapid, statistically meaningful signal about which intent clusters convert, which messages resonate, and which landing page structures produce better outcomes. Organizations that treat paid and organic as separate channels miss this entirely.
The practical logic is to test intent cluster value through paid campaigns before committing to the longer-term investment of organic content development. If a set of comparative-intent keywords converts at acceptable economics in paid search, the organic content investment required to capture that traffic for free becomes much easier to justify. Conversely, if organic content for a particular topic consistently attracts high volume but low conversion, the paid team should know to avoid that cluster and reallocate the budget toward clusters with a demonstrated transaction signal.
Google’s own research on search behaviour has noted that buyers who engage with both organic and paid results in the same session convert at higher rates than those who interact with either channel alone, suggesting that the channels reinforce each other at the intent level when messaging is aligned.
Pillar Two: Channel Synchronization
Budget Reallocation Logic
Static budget allocation, where percentages of marketing spend are assigned to channels at the beginning of a fiscal year and largely maintained regardless of performance, is one of the more persistent inefficiencies in modern marketing operations. The logic that justified an allocation six months ago may not reflect current competitive dynamics, seasonal demand patterns, or shifts in the buyer journey.
Dynamic allocation requires a shared performance framework that makes channels comparable. This is harder than it sounds, because channels optimize against different native metrics. Search engine marketing reports on ROAS and CPC. SEO teams report on rankings and organic sessions. Content teams report on engagement and backlinks. Without a common translation layer, allocating budget across them rationally is nearly impossible.
Revenue per intent cluster, where performance from all channels contributing to a given intent cluster is aggregated and measured against the total spend allocated to that cluster, provides a workable translation layer. When cluster-level revenue per dollar spent is calculated monthly across channels, budget reallocation decisions become less political and more analytical.
Message Continuity Across Touchpoints
When a prospect clicks a paid search ad for a specific software capability and lands on a generic homepage, the experience creates what behavioral economists call a “cognitive load spike,” a moment where the user must reorient and reconfirm that the destination matches their expectation. Most users do not consciously register this friction, but the data shows up clearly in bounce rates and session depth metrics.
Message continuity means that the language, value framing, and call-to-action logic used in a paid ad reflects what appears on the destination page, which in turn reflects the email sequence the user enters when they convert. It sounds obvious and is routinely ignored. The failure is not usually intentional; it is a coordination failure between teams that do not share a content taxonomy or messaging framework.
Forrester’s research on customer experience coherence found that brands perceived as delivering consistent messaging across acquisition channels and post-click experiences achieved meaningfully higher retention rates, with the effect most pronounced in categories where purchase cycles extend beyond 60 days.
Attribution Modelling and Multi-Touch Revenue Credit
Standard last-click attribution assigns full conversion credit to the final touchpoint before a purchase or lead submission. In categories with research-intensive purchase cycles, this produces systematically distorted signals. Channels that operate early and middle in the funnel, organic content, paid social, and email nurture appear to contribute nothing because they rarely occupy the last-click position. Budget consequently shifts toward late-funnel, high-intent channels that appear to be high performers primarily because they intercept buyers who were already largely convinced.
Over time, organizations running on last-click attribution tend to reduce investment in upper-funnel content that was actually building the pipeline, see their late-funnel channel costs rise as competition for high-intent traffic increases, and find that their paid search ROAS numbers deteriorate as organic and brand-building investment atrophies.
Advanced Attribution, Incrementality, and Predictive Modeling
The Distortion Problem in Standard Attribution
The problem with last-click is not simply that it undercounts upper-funnel channels. It is that it systematically misrepresents causality. A buyer who saw a display ad, read three organic blog posts over two weeks, and then converted on a branded paid search query did not convert because of that paid search query. They converted because of the full sequence of exposures and engagements. Last-click credits the final step, but the final step may have been nearly automatic given the prior engagement.
Position-based attribution models distribute credit across multiple touchpoints, typically assigning higher weight to first and last interactions while acknowledging the contribution of mid-funnel engagements. Data-driven attribution, available within Google Analytics 4 and other enterprise analytics platforms, uses algorithmic modelling to assign credit based on the actual conversion contribution of each touchpoint in the observed path, rather than relying on a fixed rule.
Neither model is perfect. Both require clean data, consistent tagging across platforms, and a definition of conversion events that reflects actual business value rather than proxy metrics. The practical standard for organizations moving beyond last-click is to run position-based attribution as a default and use data-driven models for validation when sample sizes are sufficient.
Incrementality Testing
Attribution modelling answers the question of where credit should be assigned in observed conversion paths. Incrementality testing answers a different and more fundamental question: what would have happened without this channel’s contribution?
A simple holdout test design: segment your audience into an exposed group that receives a specific channel’s touchpoints and a holdout group that does not. Measure conversion rates across both groups over a defined period, controlling for other variables. The lift in conversions attributable to the exposed group, above the holdout baseline, is your incrementality figure. This tells you what the channel is actually causing, not merely what it happens to be present for.
In practice, incrementality testing is most valuable for validating paid media investment. A remarketing campaign with high last-click ROAS may be converting users who would have converted anyway through direct or organic search. A holdout test can reveal whether the paid remarketing exposure is actually changing behaviour or simply claiming credit for inevitable purchases.
McKinsey research on marketing analytics maturity found that organisations that regularly conduct incrementality testing reallocate 15 to 25 percent of their paid media budget following the results of initial tests, typically reducing spend in channels with low incremental lift and reinvesting in channels where lift is both measurable and significant.
Predictive Revenue Modelling: A Numerical Scenario
Predictive revenue modelling connects current channel investment levels to projected revenue outcomes by working through the conversion funnel with historically observed rates. The value is not precision prediction but structured uncertainty: a framework that makes assumptions explicit and allows scenario analysis.
Scenario: SaaS company, mid-market segment
Baseline inputs:
Monthly organic sessions from target intent clusters: 18,000
Trial-to-paid conversion rate: 21% (slightly higher due to intent specificity)
Monthly new customers from paid: 36.5
Annual revenue attribution: $226,300
Combined channel revenue: approximately $734,700 annually, against combined channel costs of $264,000 (assuming $120k in SEO and content investment annually). That represents a blended revenue-to-cost ratio of approximately 2.78:1 before accounting for customer lifetime value.
If average customer lifespan is 2.6 years, the lifetime value multiplier raises the effective return considerably. This is the calculation that should anchor budget conversations, not monthly ROAS figures viewed in isolation.
Pillar Three: Conversion Infrastructure
Technical Optimization as a Revenue Variable
Conversion infrastructure begins below the visible interface. Page load times, server response times, mobile rendering fidelity, and structured data implementation are technical factors that directly influence conversion rates but are rarely owned by the same team responsible for conversion rate optimisation. The result is that CRO teams run A/B tests on button colours while the underlying pages load in 4.2 seconds on mobile, a technical constraint that will suppress any conversion improvement regardless of how well the test is designed.
Google’s Core Web Vitals research has demonstrated consistent correlation between page performance metrics and commercial outcomes, with sites meeting Largest Contentful Paint benchmarks below 2.5 seconds showing conversion rates measurably above those of slower pages in equivalent categories. The relationship is not linear, but the direction is unambiguous.
Behavioral Friction Analysis
Beyond technical performance, conversion rates are shaped by what behavioral scientists call friction points: moments in the user flow where the cognitive or procedural cost of continuing exceeds the perceived value of doing so. Friction is not always visible in aggregate conversion metrics because it often manifests as partial progression: users who start a form and abandon it or who reach a pricing page and bounce without engaging.
Friction analysis requires a combination of quantitative tools, session recording analysis, funnel visualisation with drop-off segmentation, and heuristic evaluation. The goal is to locate the specific interaction where intent exceeds friction, not simply to report that a conversion rate is lower than a benchmark.
Common structural friction sources in B2B contexts include form fields that require information buyers do not have readily available, trust signal gaps at decision-point pages, and pricing structures that are either hidden or structured in ways that create confusion rather than clarity. In e-commerce contexts, friction most commonly appears in checkout flow complexity, shipping cost revelation timing, and return policy visibility.
Structured Experimentation Architecture
Running A/B tests without a structured experimentation framework produces a collection of inconclusive results. The tests are too small to reach significance, too short to account for seasonality, or targeted at low-leverage interaction points that will not meaningfully affect revenue even if the winning variant is implemented.
A structured approach defines a testing hierarchy based on expected revenue impact per interaction point. High-traffic, high-intent pages with multiple plausible conversion improvements are tested first. Tests are scoped to achieve statistical significance within a defined time window based on current traffic volume. Test results are logged against business outcomes, not just rate changes, so the organisation accumulates a body of evidence about what works in its specific context rather than importing assumptions from published case studies in different industries.
Case Application One: B2B SaaS Procurement Platform
A procurement software company in the mid-market segment was generating substantial organic traffic from content targeting investigative intent keywords, primarily comparison guides and glossary terms. Paid search was running separately, focused on branded and competitor keywords. Conversion rates from both channels were declining quarter over quarter.
Analysis revealed two compounding problems. The SEO team had built authority in topics that attracted early-stage researchers who were rarely in active buying cycles. Simultaneously, paid search was bidding on competitor brand terms, which attracted buyers who were already committed to evaluating a different product and rarely converted to trials.
The restructuring involved rebuilding content investment around comparative and workflow-specific intent clusters where the company had a genuine competitive advantage, aligning paid campaigns with the same intent clusters at higher funnel positions to accelerate journey progression, and redesigning landing pages to reflect the specific workflow context of each intent cluster rather than presenting a generic product overview.
Over eight months, trial conversion rates from organic traffic increased from 1.9% to 3.1%. Paid search spend decreased by 18% while qualified lead volume held approximately constant because the budget was redirected from low-converting competitor terms to high-converting workflow-specific queries. Blended CAC decreased by 22%.
Case Application Two: Direct-to-Consumer Skincare Brand
A DTC skincare brand with a strong editorial presence was generating high organic traffic from skin concern content but converting at significantly below category benchmarks. ROAS from paid social was declining as audience saturation increased in its core demographic.
The diagnostic process identified a message continuity failure: organic content positioned the brand around ingredient science and formulation integrity, while paid ads used promotional discount messaging targeting impulse purchase behavior. The two channels were attracting different buyer mindsets, and the conversion infrastructure was designed for neither coherently.
Restructuring aligned organic content, paid creative, and landing page architecture around a unified value narrative focused on formulation specificity. Paid social creative was redesigned to attract buyers with higher ingredient literacy, accepting a lower initial click volume in exchange for higher conversion rates. Product pages were restructured to address specific skin concern contexts rather than presenting ingredient lists in isolation.
HubSpot benchmark data from their annual State of Marketing report provided internal guidance on email nurture cadence for the post-first-purchase sequence, which was redesigned to drive second-order conversion. Average order value increased by 14% as upsell positioning improved. Twelve-month retention rates improved from 31% to 44%, primarily driven by the alignment between acquisition messaging and product experience.
The Growth Flywheel Mechanism
The architecture described in this article produces compounding returns because its components reinforce each other in ways that are not available to siloed channel strategies. Organic content investment improves paid search quality scores and reduces CPCs. Paid campaigns generate intent data that informs organic content prioritization. Conversion improvements raise the revenue ceiling of both channels simultaneously, which justifies greater investment, which strengthens the competitive position of the organic content over time.
This compounding is not automatic. It requires the organisational scaffolding to actually transfer insights between channels: shared content taxonomies, joint intent cluster ownership, and integrated reporting that makes cross-channel relationships visible rather than hiding them within siloed dashboards. The flywheel analogy is structurally accurate in that early rotation requires disproportionate effort. The payoff is that the marginal investment cost decreases as the system matures, while the marginal revenue output increases.
Implementation Blueprint
Phase One: Diagnostic Alignment (Months 1 to 2)
The first phase is diagnostic, not executional. The work involves mapping current channel performance against intent cluster frameworks, conducting a message continuity audit across acquisition channels and post-click experiences, establishing baseline blended CAC by calculating total marketing spend divided by total new customers for the prior twelve months, and identifying the highest-revenue-density intent clusters that are either unaddressed or underperforming in current channel strategy.
Attribution infrastructure should be evaluated and upgraded in this phase. If the organization is running on last-click attribution, the transition to position-based or data-driven models should begin immediately, because all subsequent strategic decisions depend on more accurate signal.
Phase Two: Infrastructure Buildout (Months 3 to 5)
Phase two builds the technical and content infrastructure required to execute the aligned strategy. High-priority intent clusters receive dedicated content development and page architecture. Paid campaigns are restructured to operate within the shared intent framework. Landing pages are rebuilt or significantly revised to reflect message continuity. Technical performance issues identified in the audit are resolved in parallel, typically in coordination with development resources.
Incrementality tests should be designed and launched during this phase, with initial results expected by the end of phase two. These results will inform the budget reallocation decisions that characterize phase three.
Phase Three: Optimization and Scaling (Months 6 to 12)
Phase three applies the structured experimentation architecture to conversion optimization across high-intent pages, uses incrementality test results to reallocate budget toward channels with demonstrated lift, builds out predictive revenue models using six months of integrated data, and begins the process of expanding the intent cluster coverage based on demonstrated performance in the initial clusters.
Reporting in this phase shifts from channel-native metrics to integrated metrics: revenue per intent cluster, blended CAC, and customer lifetime value segmented by acquisition source. These metrics make the cross-channel architecture visible to leadership and create the organizational buy-in needed to maintain structural integration over time.
Infographic Framework: Visual Layers for Designers
The following four visual layers are recommended for a companion infographic that maps the integrated architecture described in this article.
Layer 1: Intent Cluster Pyramid A vertical pyramid with four horizontal bands representing the four intent layers (investigative, comparative, transactional, retention). Each band should display expected conversion rate range, appropriate channel mix, and revenue density index. Color progression from light at the base to dark at the transactional layer communicates increasing revenue concentration. Annotations should note the typical traffic volume distribution: most volume at the base, most revenue potential toward the top.
Layer 2: Channel Synchronisation Diagram A circular flow diagram showing three nodes (SEO, Paid Media, and Conversion Infrastructure) connected by directional arrows. Each directional arrow should be labelled with the specific data or insight type that flows between channels: intent signal, quality score impact, conversion rate data, message framework. A central hub labelled “Shared Intent Taxonomy” connects all three nodes, visually representing the coordination mechanism rather than simply the channels themselves.
Layer 3: Attribution Model Comparison A horizontal bar chart showing three attribution models (last-click, position-based, and data-driven) applied to a hypothetical five-touchpoint conversion path. Each model distributes credit differently across the same path. The visual should make the distortion of last-click immediately apparent by showing how it concentrates 100% of credit on a single touchpoint that appeared late in a journey that clearly began much earlier.
Layer 4: Predictive Revenue Modelling Funnel A stepped funnel visualisation showing the numerical scenario from the predictive modelling section: sessions to trial starts to paid conversions to annual revenue, with the paid and organic channels shown as parallel tracks that merge at the revenue calculation. A secondary annotation layer shows how changes in conversion rate at each step propagate through to revenue outcomes, illustrating the leverage effect of mid-funnel improvements versus top-of-funnel volume increases.
Conclusion
The core argument of this article is architectural: sustainable digital revenue growth does not emerge from optimising individual channels in isolation but from designing a system in which search intent intelligence, channel coordination, and conversion infrastructure operate with shared logic and mutual feedback. Channel fragmentation is not an operational inconvenience; it is a structural constraint on growth that expresses itself in rising acquisition costs, declining conversion rates, and attribution data that obscures more than it reveals.
The three pillars described here are not novel concepts independently. Intent-based SEO, cross-channel attribution, and conversion optimisation are well-understood disciplines with substantial practitioner literature. What is less commonly addressed is the integration layer: the mechanisms by which these disciplines can share data, align on strategy, and compound returns over time rather than operating as parallel cost centres.
Organisations that build this architecture do so gradually and iteratively. The diagnostic phase matters as much as the execution phases, because misdiagnosis leads to structural solutions applied to the wrong problems. The implementation blueprint provided here is a sequence, not a checklist, and the judgment required to adapt it to specific competitive contexts, organizational structures, and data environments is where strategy actually lives.
The arithmetic of integrated growth is straightforward once the system is running: lower CAC multiplied by higher conversion rates multiplied by longer customer retention produces a materially different revenue trajectory than the sum of three independently optimized channels ever would.
About the Author
The author is a digital marketing strategist focused on building integrated growth systems that align search visibility, paid acquisition, and conversion performance. His work centers on designing structured marketing frameworks that prioritize revenue efficiency over isolated channel metrics. He regularly explores practical approaches to intent mapping, attribution clarity, and scalable digital performance. More insights can be found atgaznil.com.
Artificial Intelligence 2025: From Cyber Cafés to Chaya Kada Conversations
From Typewriters to Talking Tech: How Artificial Intelligence Transformed Kerala Life (But Still Can’t Make Chaya Right ?)
Kerala has always been quick to catch the tech train—from the days of dusty cyber cafés in Kochi to AI-powered startups sprouting in Technopark.From the early days of dusty cyber cafés in Kochi to the emergence of AI-powered startups in Technopark, Kerala has always been quick to jump on the tech bandwagon. Thanks to WhatsApp’s “AI experts,” artificial intelligence has transformed the way we work, learn, and even gossip.
Kerala has always been quick to catch the tech train—from the days of dusty cyber cafés in Kochi to AI-powered startups sprouting in Technopark.From the early days of dusty cyber cafés in Kochi to the emergence of AI-powered startups in Technopark, Kerala has always been quick to jump on the tech bandwagon. Thanks to WhatsApp’s “AI experts,” artificial intelligence has transformed the way we work, learn, and even gossip. Businesses now automate tasks that were previously completed by three men and a cup of tea, and students use AI to summarise notes more quickly than a Kozhikode bus driver can honk. Despite all of its genius, artificial intelligence is unable to replicate the essence of a Malayali’s inventiveness, including our sarcasm, feelings, and the underlying reasoning behind when to add extra curry leaves to the sambar.
When Algorithms Meet Amma’s Advice: What Artificial Intelligence Still Gets Wrong
When algorithms meet Amma’s advice, the result is a classic Kerala pickle—confusing yet oddly entertaining! Although artificial intelligence is capable of performing mathematical calculations, analysing data, and even writing a respectable poem, attempting to make it comprehend Amma’s wisdom would be awkward and out of sync, much like asking a robot to dance to a Mohiniyattam beat. Amma’s counsel is laced with sentiments, customs, and that unique brand of sarcasm that only Kerala has developed over many generations while enjoying chaya on a soggy night. AI in 2025 will still be unable to understand why Amma insists on adding “just a little more salt” or why her renowned “chodyams” (questions) can leave even the most perceptive minds baffled.
Tech Talks & Tea: Kerala’s Artificial Intelligence Era in 2025
Move over film stars—2025’s biggest celebrity in Kerala is artificial intelligence! Whether you’re stuck in Technopark traffic or sipping tea at your favorite street-side chaya kada, AI is working hard to make your day easier. Students now receive homework helpers who don’t crave “pazhampori” breaks, shuhaib’s phone can now predict when the next pothole will appear, and Malayalam chatbots assist aunties in finding the freshest sardines (though, let’s face it, AI still can’t haggle like a Thalassery fishmonger!). Artificial intelligence is becoming more and more prevalent, which reduces workloads and, let’s face it, makes life a little more enjoyable. That is, until someone asks it to explain the politics on Onam game night
What Artificial Intelligence Still Can’t Do in Kerala, Even in 2025:
Choose the ideal tea leaves for the chaya made by Michu. No way.At Onam game night, resolve political disputes? To be honest, AI would retire. Bargain with fish vendors in Thalassery? Perhaps in “AI 2050.”Describe how Amma’s advice can occasionally feel like a mathematical puzzle. soothe you following a breakup? A Bachelor Uncle Update is still needed for AI!Create a novel twist in the Mohanlal storyline? No, only remix mode is available.
AI in 2025: Serious Skills Beneath the Chaya Shop Banner
As Kerala’s daily life embraces artificial intelligence, let’s get real about what’s brewing under the hood (other than tea):
AI-Driven Automation: Companies in cities like Kochi and Kozhikode are using AI to automate inventory, customer service, and logistics. No one is still having to make three people do the same task! “2025 AI” means less paperwork clogging the counters and more intelligent workflows.
Enhancements in Healthcare:
By 2025, hospitals in Kerala will be powered by “artificial intelligence.” Fast patient records, well-timed appointments, and immediate diagnosis—all incredibly efficient! However, try asking AI to explain Grandpa’s insistence on jeeraka kashayam following an X-ray. Or why, behind the curtain, every patient swears by Amma’s secret pickle. AI excels at numbers, but what about our home remedies? That’s a different syllabus!
Smart Learning Tools:
In 2025, schools throughout the state will use AI to offer individualised instruction, homework assistance, and even Malayalam language tutoring. Even if a student forgets their lunchbox, “AI classmate” bots make sure they receive extra help.
Traffic & Safety Technologies:
From Trivandrum to Thalassery, AI cameras are now widely used. Rates of accidents? I’m dropping! SMS penalties? Artificial intelligence is the most unbiased traffic cop Kerala has ever seen, regardless of your profession—politician or fisherman. However, is it able to anticipate monsoon potholes or prevent drivers from parking creatively? Bro , not yet!
Agricultural Innovation:
By 2025, artificial intelligence is assisting farmers in better resource management, yield prediction, and crop health monitoring. Artificial intelligence-powered apps are helping local farmers with everything from pest control to monsoon planning. However, is it able to anticipate monsoon potholes or prevent drivers from parking creatively? Bro , not yet!
Current Information:
Kerala is one of India’s leading AI adopters in 2025, as evidenced by the establishment of innovation hubs and hackathons centred around “artificial intelligence”, robotics, and digital skills at state-sponsored tech parks. Chatbots and support lines are becoming smarter and more Malayalam-friendly thanks to new AI models like GPT-5 that improve natural language understanding.
From traffic management to smarter schooling and streamlined businesses, artificial intelligence in Kerala is more than just chai-side banter—it’s powering real progress in every nook and corner. And as AI in 2025 continues to evolve, Kerala’s blend of tradition and tech looks stronger than ever.
AI Progress in Kannur: My Hometown Meets Artificial Intelligence 2025
Artificial intelligence is a real topic that is becoming more and more popular every day in Kannur, where I live. Everyone is talking about artificial intelligence in 2025, from the bustling tea stalls near Payyambalam to the new startups in Thalassery. Artificial intelligence is being used by local businesses to improve customer service and inventory management; even our renowned Kannur biriyani stores are switching to predictive ordering!
Traffic police are testing AI cameras at busy intersections, healthcare facilities are implementing smart diagnostics for quick examinations, and Kannur schools are launching AI-powered apps that help students solve challenging maths problems (no more copying from the back bench). By employing 2025 AI to track their crops and predict the optimal harvest times based on real-time weather updates, Kannur farmers are also experimenting with artificial intelligence.
As a Kannur guy, seeing my own town dive into artificial intelligence makes me both proud and excited—it’s not just a techy urban thing. Here in Kannur, AI in 2025 is helping keep traditions alive while solving everyday challenges the smart way. And who knows? Maybe one day artificial intelligence will even help perfect Kannur’s famous pathiri!
And that’s the latest on how artificial intelligence is stirring up Kerala—right from the chaya kadas in Kannur to Technopark’s busy desks. As a digital marketer from Kannur, I’m always watching how AI mixes tradition, technology, and a dash of Malayali humour to make life more interesting. If you’ve enjoyed this blog, don’t forget to explore my other posts for more laughs, tech tips, and Kerala insights. Connect with me on social media—for new updates, behind-the-scenes peeks, and maybe the occasional sambar meme. See you there, and stay curious!