
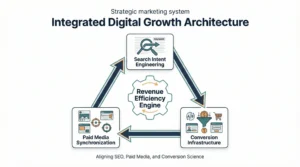
The Integrated Digital Growth Architecture: Aligning SEO, Paid Media, and Conversion Science for Sustainable Revenue
The Integrated Digital Growth Architecture: Aligning SEO, Paid Media, and Conversion Science for Sustainable Revenue
Most organisations that struggle with digital growth do not have a traffic problem. They have a systems problem. Channels operate in silos, teams optimise against isolated KPIs, and the cumulative result is a marketing organisation that generates activity without generating compounding value. Search teams chase rankings. Paid media teams chase ROAS targets. Conversion teams, where they exist at all, work downstream of both, reacting to traffic they had no hand in shaping.
The architecture problem is structural. When each function optimizes for its own metrics, the system cannot optimise for revenue. The relationship between acquisition cost, conversion probability, and customer value remains opaque, making it nearly impossible to deploy budget intelligently or forecast outcomes with any reliability.
his article is not about tactics in isolation. It is about the logic of integration: how search intent, channel synchronisation, and conversion infrastructure can be designed to function as a single revenue system rather than three separate cost centres reporting to the same CMO.
The Cost of Channel Fragmentation
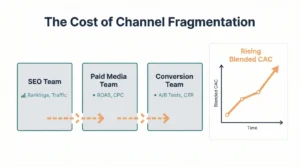
Fragmented channel management has a measurable cost that most organisations either underestimate or misattribute entirely. When paid and organic search teams operate without shared intent data, the same keyword clusters are frequently addressed with different messaging, different landing pages, and different value propositions. The user experiences inconsistency. Conversion rates suffer. And because the fragmentation is structural, the failure never surfaces cleanly in any single channel’s reporting.
Blended customer acquisition cost, the true cost of acquiring a customer when spending across all channels is divided by total new customers, tends to rise over time in fragmented organisations. Gartner research on marketing effectiveness has consistently found that organizations with tightly integrated channel strategies achieve 20 to 30 cents greater marketing efficiency than those managing channels independently, largely because integrated teams eliminate redundant spend and align messaging with buyer stage more precisely.
The financial implication is not marginal. In competitive categories where customer lifetime value is three to five times acquisition cost, a 25 percent reduction in blended CAC meaningfully shifts the unit economics of growth. The organisations that achieve this are not necessarily spending more. They are spending differently, guided by a shared architecture rather than siloed optimisation loops.
Pillar One: Search Intent Engineering
Mapping Intent Layers to Revenue Potential
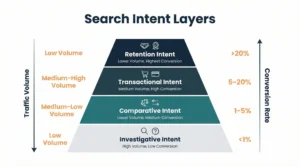
Search intent is not a binary distinction between informational and transactional queries. It exists on a spectrum, and where a query sits on that spectrum has a direct relationship to its conversion probability and downstream revenue value. Treating all search traffic as equivalent leads to misallocated content investment and distorted performance signals.
A more useful framework segments intent into four layers: investigative intent, which reflects early-stage research behavior; comparative intent, where buyers are evaluating alternatives; transactional intent, where the user is prepared to act; and retention intent, where existing customers search for support, upgrades, or adjacent solutions. Each layer has a different expected conversion rate, a different optimal content format, and a different relationship to paid media.
The critical insight is that most organizations over-invest in investigative intent content, which generates traffic and brand familiarity but rarely converts directly, and under-invest in comparative and transactional intent content, which drives revenue but requires deeper competitive understanding and more precise page architecture.
Revenue Density Modeling
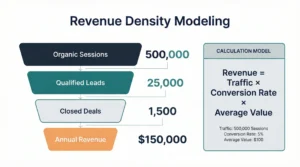
Revenue density, the expected revenue generated per 1,000 organic impressions, provides a useful frame for prioritising SEO investment. It incorporates click-through rate by position, conversion rate by intent category, and average order or contract value. The calculation is straightforward in principle, but requires clean data to execute honestly.
Example calculation:
Consider a keyword cluster targeting comparative intent in a B2B software context:
- Estimated monthly search volume: 4,200
- Organic click-through rate at position 2: 14%
- Monthly clicks: approximately 588
- Conversion rate from page to qualified lead: 3.2%
- Qualified leads per month: approximately 18.8
- Lead-to-close rate: 22%
- Closed deals per month: approximately 4.1
- Average contract value: $8,400
Revenue density for this cluster: approximately $34,440 per month if ranking is achieved and maintained. Against a content production and link acquisition cost of $6,000 over six months, the ROI is substantial and scales without proportional cost increases as rankings stabilise.
This type of modelling reframes the SEO investment conversation from “how many keywords can we rank for?” to “which intent clusters deliver the highest revenue per dollar of organic visibility?”
The Paid and Organic Validation Loop
Paid search serves a purpose that goes beyond immediate revenue generation: it provides rapid, statistically meaningful signal about which intent clusters convert, which messages resonate, and which landing page structures produce better outcomes. Organizations that treat paid and organic as separate channels miss this entirely.
The practical logic is to test intent cluster value through paid campaigns before committing to the longer-term investment of organic content development. If a set of comparative-intent keywords converts at acceptable economics in paid search, the organic content investment required to capture that traffic for free becomes much easier to justify. Conversely, if organic content for a particular topic consistently attracts high volume but low conversion, the paid team should know to avoid that cluster and reallocate the budget toward clusters with a demonstrated transaction signal.
Google’s own research on search behaviour has noted that buyers who engage with both organic and paid results in the same session convert at higher rates than those who interact with either channel alone, suggesting that the channels reinforce each other at the intent level when messaging is aligned.
Pillar Two: Channel Synchronization
Budget Reallocation Logic
Static budget allocation, where percentages of marketing spend are assigned to channels at the beginning of a fiscal year and largely maintained regardless of performance, is one of the more persistent inefficiencies in modern marketing operations. The logic that justified an allocation six months ago may not reflect current competitive dynamics, seasonal demand patterns, or shifts in the buyer journey.
Dynamic allocation requires a shared performance framework that makes channels comparable. This is harder than it sounds, because channels optimize against different native metrics. Search engine marketing reports on ROAS and CPC. SEO teams report on rankings and organic sessions. Content teams report on engagement and backlinks. Without a common translation layer, allocating budget across them rationally is nearly impossible.
Revenue per intent cluster, where performance from all channels contributing to a given intent cluster is aggregated and measured against the total spend allocated to that cluster, provides a workable translation layer. When cluster-level revenue per dollar spent is calculated monthly across channels, budget reallocation decisions become less political and more analytical.
Message Continuity Across Touchpoints
When a prospect clicks a paid search ad for a specific software capability and lands on a generic homepage, the experience creates what behavioral economists call a “cognitive load spike,” a moment where the user must reorient and reconfirm that the destination matches their expectation. Most users do not consciously register this friction, but the data shows up clearly in bounce rates and session depth metrics.
Message continuity means that the language, value framing, and call-to-action logic used in a paid ad reflects what appears on the destination page, which in turn reflects the email sequence the user enters when they convert. It sounds obvious and is routinely ignored. The failure is not usually intentional; it is a coordination failure between teams that do not share a content taxonomy or messaging framework.
Forrester’s research on customer experience coherence found that brands perceived as delivering consistent messaging across acquisition channels and post-click experiences achieved meaningfully higher retention rates, with the effect most pronounced in categories where purchase cycles extend beyond 60 days.
Attribution Modelling and Multi-Touch Revenue Credit
Standard last-click attribution assigns full conversion credit to the final touchpoint before a purchase or lead submission. In categories with research-intensive purchase cycles, this produces systematically distorted signals. Channels that operate early and middle in the funnel, organic content, paid social, and email nurture appear to contribute nothing because they rarely occupy the last-click position. Budget consequently shifts toward late-funnel, high-intent channels that appear to be high performers primarily because they intercept buyers who were already largely convinced.
Over time, organizations running on last-click attribution tend to reduce investment in upper-funnel content that was actually building the pipeline, see their late-funnel channel costs rise as competition for high-intent traffic increases, and find that their paid search ROAS numbers deteriorate as organic and brand-building investment atrophies.
Advanced Attribution, Incrementality, and Predictive Modeling
The Distortion Problem in Standard Attribution
The problem with last-click is not simply that it undercounts upper-funnel channels. It is that it systematically misrepresents causality. A buyer who saw a display ad, read three organic blog posts over two weeks, and then converted on a branded paid search query did not convert because of that paid search query. They converted because of the full sequence of exposures and engagements. Last-click credits the final step, but the final step may have been nearly automatic given the prior engagement.
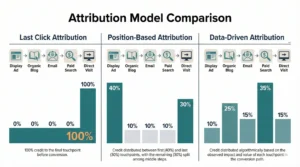
Position-based attribution models distribute credit across multiple touchpoints, typically assigning higher weight to first and last interactions while acknowledging the contribution of mid-funnel engagements. Data-driven attribution, available within Google Analytics 4 and other enterprise analytics platforms, uses algorithmic modelling to assign credit based on the actual conversion contribution of each touchpoint in the observed path, rather than relying on a fixed rule.
Neither model is perfect. Both require clean data, consistent tagging across platforms, and a definition of conversion events that reflects actual business value rather than proxy metrics. The practical standard for organizations moving beyond last-click is to run position-based attribution as a default and use data-driven models for validation when sample sizes are sufficient.
Incrementality Testing
Attribution modelling answers the question of where credit should be assigned in observed conversion paths. Incrementality testing answers a different and more fundamental question: what would have happened without this channel’s contribution?
A simple holdout test design: segment your audience into an exposed group that receives a specific channel’s touchpoints and a holdout group that does not. Measure conversion rates across both groups over a defined period, controlling for other variables. The lift in conversions attributable to the exposed group, above the holdout baseline, is your incrementality figure. This tells you what the channel is actually causing, not merely what it happens to be present for.
In practice, incrementality testing is most valuable for validating paid media investment. A remarketing campaign with high last-click ROAS may be converting users who would have converted anyway through direct or organic search. A holdout test can reveal whether the paid remarketing exposure is actually changing behaviour or simply claiming credit for inevitable purchases.
McKinsey research on marketing analytics maturity found that organisations that regularly conduct incrementality testing reallocate 15 to 25 percent of their paid media budget following the results of initial tests, typically reducing spend in channels with low incremental lift and reinvesting in channels where lift is both measurable and significant.
Predictive Revenue Modelling: A Numerical Scenario
Predictive revenue modelling connects current channel investment levels to projected revenue outcomes by working through the conversion funnel with historically observed rates. The value is not precision prediction but structured uncertainty: a framework that makes assumptions explicit and allows scenario analysis.
Scenario: SaaS company, mid-market segment
Baseline inputs:
- Monthly organic sessions from target intent clusters: 18,000
- Organic conversion rate to trial: 2.4%
- Monthly organic trial starts: 432
- Trial-to-paid conversion rate: 19%
- Monthly new customers from organic: 82
- Average annual contract value: $6,200
- Projected organic annual revenue contribution: $508,400
Paid search parallel:
- Monthly paid search spend: $22,000
- Cost per click: $4.80
- Monthly clicks: approximately 4,583
- Paid landing page conversion rate to trial: 3.8%
- Paid trial starts: 174
- Trial-to-paid conversion rate: 21% (slightly higher due to intent specificity)
- Monthly new customers from paid: 36.5
- Annual revenue attribution: $226,300
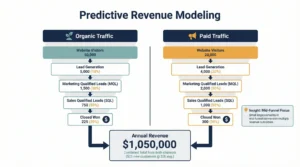
Combined channel revenue: approximately $734,700 annually, against combined channel costs of $264,000 (assuming $120k in SEO and content investment annually). That represents a blended revenue-to-cost ratio of approximately 2.78:1 before accounting for customer lifetime value.
If average customer lifespan is 2.6 years, the lifetime value multiplier raises the effective return considerably. This is the calculation that should anchor budget conversations, not monthly ROAS figures viewed in isolation.
Pillar Three: Conversion Infrastructure
Technical Optimization as a Revenue Variable
Conversion infrastructure begins below the visible interface. Page load times, server response times, mobile rendering fidelity, and structured data implementation are technical factors that directly influence conversion rates but are rarely owned by the same team responsible for conversion rate optimisation. The result is that CRO teams run A/B tests on button colours while the underlying pages load in 4.2 seconds on mobile, a technical constraint that will suppress any conversion improvement regardless of how well the test is designed.
Google’s Core Web Vitals research has demonstrated consistent correlation between page performance metrics and commercial outcomes, with sites meeting Largest Contentful Paint benchmarks below 2.5 seconds showing conversion rates measurably above those of slower pages in equivalent categories. The relationship is not linear, but the direction is unambiguous.
Behavioral Friction Analysis
Beyond technical performance, conversion rates are shaped by what behavioral scientists call friction points: moments in the user flow where the cognitive or procedural cost of continuing exceeds the perceived value of doing so. Friction is not always visible in aggregate conversion metrics because it often manifests as partial progression: users who start a form and abandon it or who reach a pricing page and bounce without engaging.
Friction analysis requires a combination of quantitative tools, session recording analysis, funnel visualisation with drop-off segmentation, and heuristic evaluation. The goal is to locate the specific interaction where intent exceeds friction, not simply to report that a conversion rate is lower than a benchmark.
Common structural friction sources in B2B contexts include form fields that require information buyers do not have readily available, trust signal gaps at decision-point pages, and pricing structures that are either hidden or structured in ways that create confusion rather than clarity. In e-commerce contexts, friction most commonly appears in checkout flow complexity, shipping cost revelation timing, and return policy visibility.
Structured Experimentation Architecture
Running A/B tests without a structured experimentation framework produces a collection of inconclusive results. The tests are too small to reach significance, too short to account for seasonality, or targeted at low-leverage interaction points that will not meaningfully affect revenue even if the winning variant is implemented.
A structured approach defines a testing hierarchy based on expected revenue impact per interaction point. High-traffic, high-intent pages with multiple plausible conversion improvements are tested first. Tests are scoped to achieve statistical significance within a defined time window based on current traffic volume. Test results are logged against business outcomes, not just rate changes, so the organisation accumulates a body of evidence about what works in its specific context rather than importing assumptions from published case studies in different industries.
Case Application One: B2B SaaS Procurement Platform
A procurement software company in the mid-market segment was generating substantial organic traffic from content targeting investigative intent keywords, primarily comparison guides and glossary terms. Paid search was running separately, focused on branded and competitor keywords. Conversion rates from both channels were declining quarter over quarter.
Analysis revealed two compounding problems. The SEO team had built authority in topics that attracted early-stage researchers who were rarely in active buying cycles. Simultaneously, paid search was bidding on competitor brand terms, which attracted buyers who were already committed to evaluating a different product and rarely converted to trials.
The restructuring involved rebuilding content investment around comparative and workflow-specific intent clusters where the company had a genuine competitive advantage, aligning paid campaigns with the same intent clusters at higher funnel positions to accelerate journey progression, and redesigning landing pages to reflect the specific workflow context of each intent cluster rather than presenting a generic product overview.
Over eight months, trial conversion rates from organic traffic increased from 1.9% to 3.1%. Paid search spend decreased by 18% while qualified lead volume held approximately constant because the budget was redirected from low-converting competitor terms to high-converting workflow-specific queries. Blended CAC decreased by 22%.
Case Application Two: Direct-to-Consumer Skincare Brand
A DTC skincare brand with a strong editorial presence was generating high organic traffic from skin concern content but converting at significantly below category benchmarks. ROAS from paid social was declining as audience saturation increased in its core demographic.
The diagnostic process identified a message continuity failure: organic content positioned the brand around ingredient science and formulation integrity, while paid ads used promotional discount messaging targeting impulse purchase behavior. The two channels were attracting different buyer mindsets, and the conversion infrastructure was designed for neither coherently.
Restructuring aligned organic content, paid creative, and landing page architecture around a unified value narrative focused on formulation specificity. Paid social creative was redesigned to attract buyers with higher ingredient literacy, accepting a lower initial click volume in exchange for higher conversion rates. Product pages were restructured to address specific skin concern contexts rather than presenting ingredient lists in isolation.
HubSpot benchmark data from their annual State of Marketing report provided internal guidance on email nurture cadence for the post-first-purchase sequence, which was redesigned to drive second-order conversion. Average order value increased by 14% as upsell positioning improved. Twelve-month retention rates improved from 31% to 44%, primarily driven by the alignment between acquisition messaging and product experience.
The Growth Flywheel Mechanism
The architecture described in this article produces compounding returns because its components reinforce each other in ways that are not available to siloed channel strategies. Organic content investment improves paid search quality scores and reduces CPCs. Paid campaigns generate intent data that informs organic content prioritization. Conversion improvements raise the revenue ceiling of both channels simultaneously, which justifies greater investment, which strengthens the competitive position of the organic content over time.
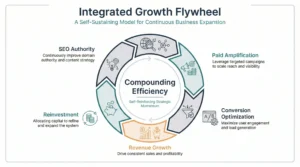
This compounding is not automatic. It requires the organisational scaffolding to actually transfer insights between channels: shared content taxonomies, joint intent cluster ownership, and integrated reporting that makes cross-channel relationships visible rather than hiding them within siloed dashboards. The flywheel analogy is structurally accurate in that early rotation requires disproportionate effort. The payoff is that the marginal investment cost decreases as the system matures, while the marginal revenue output increases.
Implementation Blueprint
Phase One: Diagnostic Alignment (Months 1 to 2)
The first phase is diagnostic, not executional. The work involves mapping current channel performance against intent cluster frameworks, conducting a message continuity audit across acquisition channels and post-click experiences, establishing baseline blended CAC by calculating total marketing spend divided by total new customers for the prior twelve months, and identifying the highest-revenue-density intent clusters that are either unaddressed or underperforming in current channel strategy.
Attribution infrastructure should be evaluated and upgraded in this phase. If the organization is running on last-click attribution, the transition to position-based or data-driven models should begin immediately, because all subsequent strategic decisions depend on more accurate signal.
Phase Two: Infrastructure Buildout (Months 3 to 5)
Phase two builds the technical and content infrastructure required to execute the aligned strategy. High-priority intent clusters receive dedicated content development and page architecture. Paid campaigns are restructured to operate within the shared intent framework. Landing pages are rebuilt or significantly revised to reflect message continuity. Technical performance issues identified in the audit are resolved in parallel, typically in coordination with development resources.
Incrementality tests should be designed and launched during this phase, with initial results expected by the end of phase two. These results will inform the budget reallocation decisions that characterize phase three.
Phase Three: Optimization and Scaling (Months 6 to 12)
Phase three applies the structured experimentation architecture to conversion optimization across high-intent pages, uses incrementality test results to reallocate budget toward channels with demonstrated lift, builds out predictive revenue models using six months of integrated data, and begins the process of expanding the intent cluster coverage based on demonstrated performance in the initial clusters.
Reporting in this phase shifts from channel-native metrics to integrated metrics: revenue per intent cluster, blended CAC, and customer lifetime value segmented by acquisition source. These metrics make the cross-channel architecture visible to leadership and create the organizational buy-in needed to maintain structural integration over time.
Infographic Framework: Visual Layers for Designers
The following four visual layers are recommended for a companion infographic that maps the integrated architecture described in this article.
Layer 1: Intent Cluster Pyramid A vertical pyramid with four horizontal bands representing the four intent layers (investigative, comparative, transactional, retention). Each band should display expected conversion rate range, appropriate channel mix, and revenue density index. Color progression from light at the base to dark at the transactional layer communicates increasing revenue concentration. Annotations should note the typical traffic volume distribution: most volume at the base, most revenue potential toward the top.
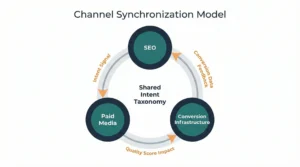
Layer 2: Channel Synchronisation Diagram A circular flow diagram showing three nodes (SEO, Paid Media, and Conversion Infrastructure) connected by directional arrows. Each directional arrow should be labelled with the specific data or insight type that flows between channels: intent signal, quality score impact, conversion rate data, message framework. A central hub labelled “Shared Intent Taxonomy” connects all three nodes, visually representing the coordination mechanism rather than simply the channels themselves.
Layer 3: Attribution Model Comparison A horizontal bar chart showing three attribution models (last-click, position-based, and data-driven) applied to a hypothetical five-touchpoint conversion path. Each model distributes credit differently across the same path. The visual should make the distortion of last-click immediately apparent by showing how it concentrates 100% of credit on a single touchpoint that appeared late in a journey that clearly began much earlier.
Layer 4: Predictive Revenue Modelling Funnel A stepped funnel visualisation showing the numerical scenario from the predictive modelling section: sessions to trial starts to paid conversions to annual revenue, with the paid and organic channels shown as parallel tracks that merge at the revenue calculation. A secondary annotation layer shows how changes in conversion rate at each step propagate through to revenue outcomes, illustrating the leverage effect of mid-funnel improvements versus top-of-funnel volume increases.
Conclusion
The core argument of this article is architectural: sustainable digital revenue growth does not emerge from optimising individual channels in isolation but from designing a system in which search intent intelligence, channel coordination, and conversion infrastructure operate with shared logic and mutual feedback. Channel fragmentation is not an operational inconvenience; it is a structural constraint on growth that expresses itself in rising acquisition costs, declining conversion rates, and attribution data that obscures more than it reveals.
The three pillars described here are not novel concepts independently. Intent-based SEO, cross-channel attribution, and conversion optimisation are well-understood disciplines with substantial practitioner literature. What is less commonly addressed is the integration layer: the mechanisms by which these disciplines can share data, align on strategy, and compound returns over time rather than operating as parallel cost centres.
Organisations that build this architecture do so gradually and iteratively. The diagnostic phase matters as much as the execution phases, because misdiagnosis leads to structural solutions applied to the wrong problems. The implementation blueprint provided here is a sequence, not a checklist, and the judgment required to adapt it to specific competitive contexts, organizational structures, and data environments is where strategy actually lives.
The arithmetic of integrated growth is straightforward once the system is running: lower CAC multiplied by higher conversion rates multiplied by longer customer retention produces a materially different revenue trajectory than the sum of three independently optimized channels ever would.
About the Author
The author is a digital marketing strategist focused on building integrated growth systems that align search visibility, paid acquisition, and conversion performance. His work centers on designing structured marketing frameworks that prioritize revenue efficiency over isolated channel metrics. He regularly explores practical approaches to intent mapping, attribution clarity, and scalable digital performance. More insights can be found at gaznil.com.


